Back to SentiCharts


Next update in
00
:
00
:
00
Rakuten
E-commerce
#15
Social index
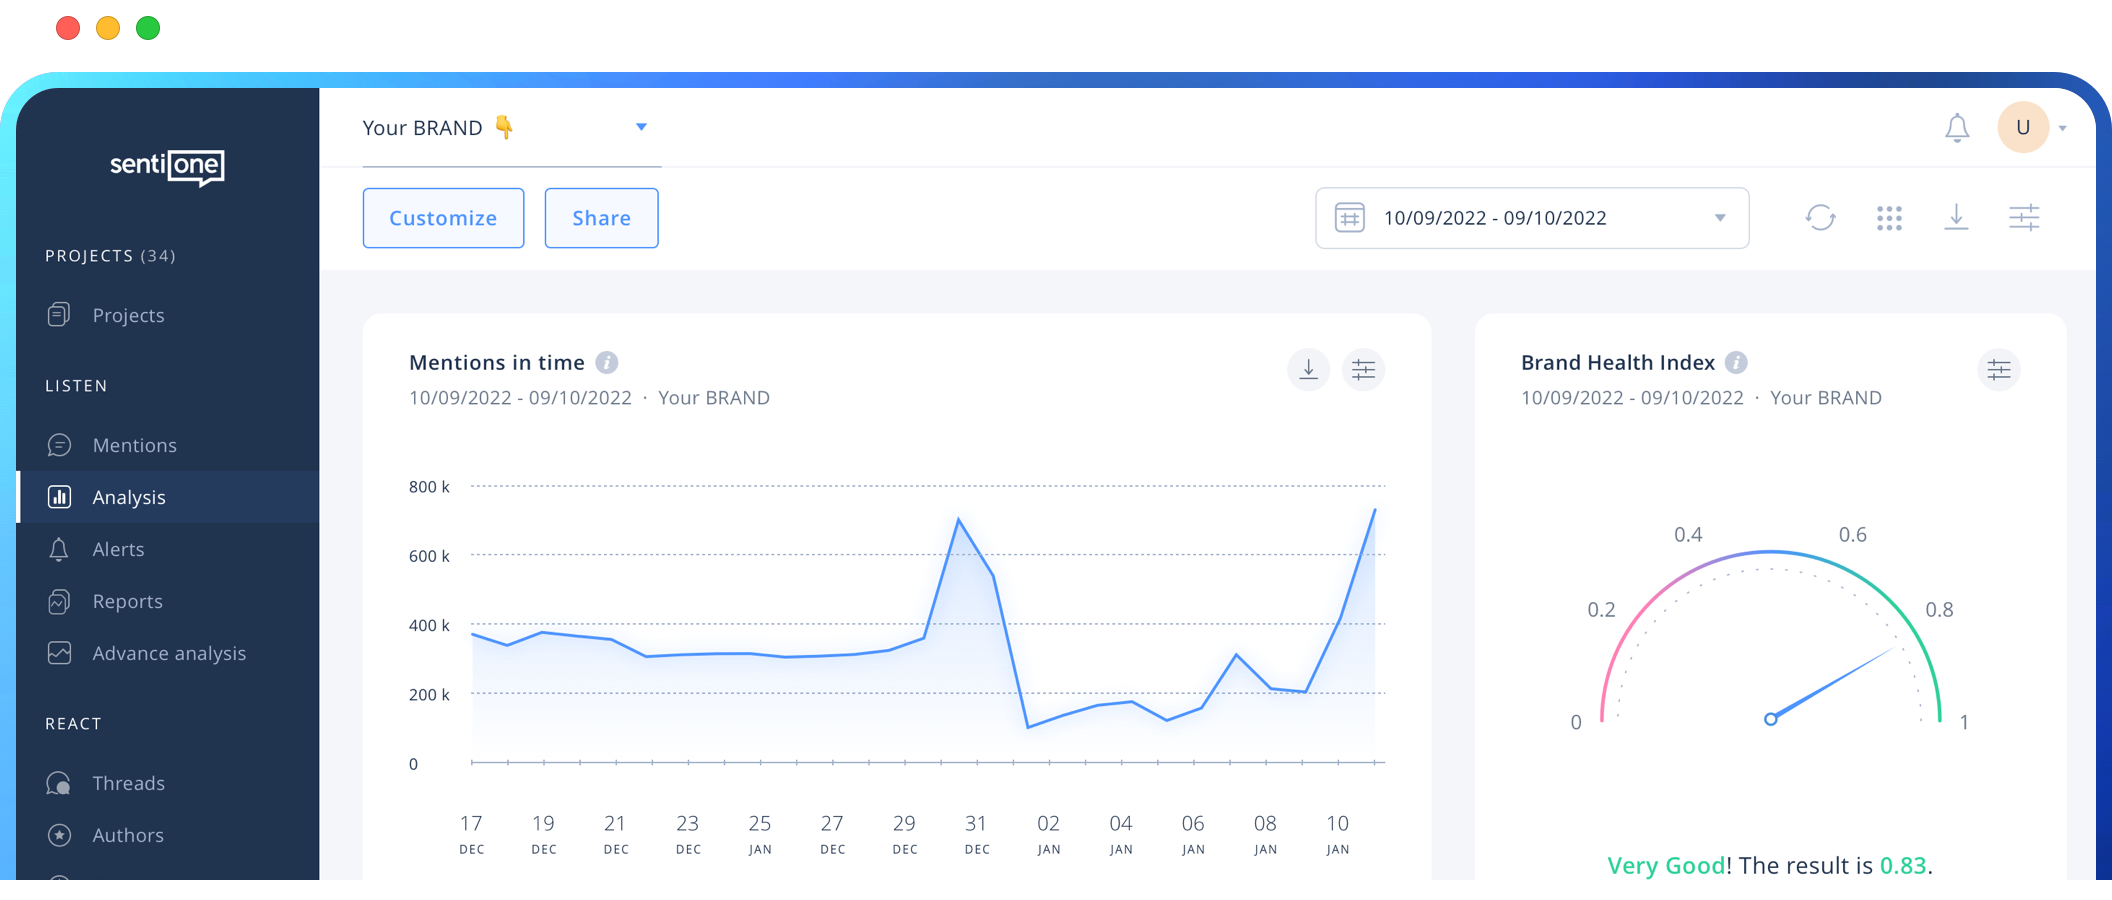
937
Mentions
2 556
BHI
0.59
This is a simplified view of SentiOne charts and graphs.
Would you like to see a more interactive version?
This is a simplified view of SentiOne charts and graphs.
Thanks for getting in touch!
Displays the reach of all results found within a given project, divided by sentiment and sources.
| Sentiment | Reach |
|---|---|
| Positive | 88980 |
| Negative | 82017 |
| Total | 1700276 |
| Source | Reach |
|---|---|
| Webpages | 1046338 |
| Social Media | 653886 |
| Total | 1700276 |
| Source | Reach |
|---|---|
| Blogs | 327987 |
| Forums | 117346 |
| Websites | 515069 |
| 3030 | |
| 22499 | |
| Video | – |
| Reviews | 85936 |
| 628357 | |
| TikTok | 50 |
Unlock more graphs, charts and insights!
Book a free demo to see all possibilities of online monitoring. Let’s analyse your brand, competition or any social trend!
Book a demoThis is a simplified view of SentiOne charts and graphs.
Would you like to see a more interactive version?
This is a simplified view of SentiOne charts and graphs.
Thanks for getting in touch!